Showing posts with label climate. Show all posts

Thursday, April 30, 2020

How does April 2020 stack up with past Aprils? And what is in store for May?

Over the last week we saw a decent amount of sun, as well as some rain and thunderstorms. We saw some great pictures and videos of hail on April 29th over the area, despite a lack of thunder in small showers. The temperatures stayed pretty pleasant this month, and it looks like that trend might continue as we head into May. 

As April winds down, where do we stand with respect to temperature and precipitation? Looking at the preliminary monthly climate report from NWS Memphis (below), we sit a couple degrees below normal (2.6 degrees to be exact). The precipitation total for this month is 5.57", which means we are slightly above average against our normal April amount of 5.25".

The preliminary monthly climate report from NWS Memphis. 
Friday and Saturday
Overnight lows going into Friday will drop into the low 50s under clear skies. Friday high clouds will move in as a high tops out in the upper 70s, a signal of a warming trend as we head into the weekend. The wind on Friday will be out of the southwest at about 8 mph. Friday night lows will only drop to the lower 60s. Saturday temperatures will top out in the lower 80s under partly cloudy skies and with a strong southerly wind. Saturday night lows will only drop to the mid 60s with partly cloudy skies sticking with us.

Sunday and Monday

As we move into Sunday we will again be partly cloudy, having highs top out in the low 80s, capping off a warn but dry weekend. Sunday night lows will drop into the mid 60s with a slight chance of a shower. Monday will be very similar to Sunday as it will be partly cloudy and top out in the low 80s. The only difference is that on Monday there will be a slight chance of showers all day. Overnight lows heading into Tuesday will again only get down to the mid 60s as more clouds move in.

Tuesday, Wednesday, and Thursday

On Tuesday a low pressure system is forecasted to move through, bringing scattered showers and thunderstorms. Temperatures top out near 80, making way for a cold front from the low pressure system. This cold front will bring falling temperatures overnight, into the upper 50s. Moving into Wednesday the cold front will likely bring pleasant temperatures in the low 70s along with partly cloudy skies. Wednesday night lows will likely drop all the way down to the low 50s. Heading into Friday, temperatures will again be rather pleasant as we will top out around 70 under partly sunny skies.

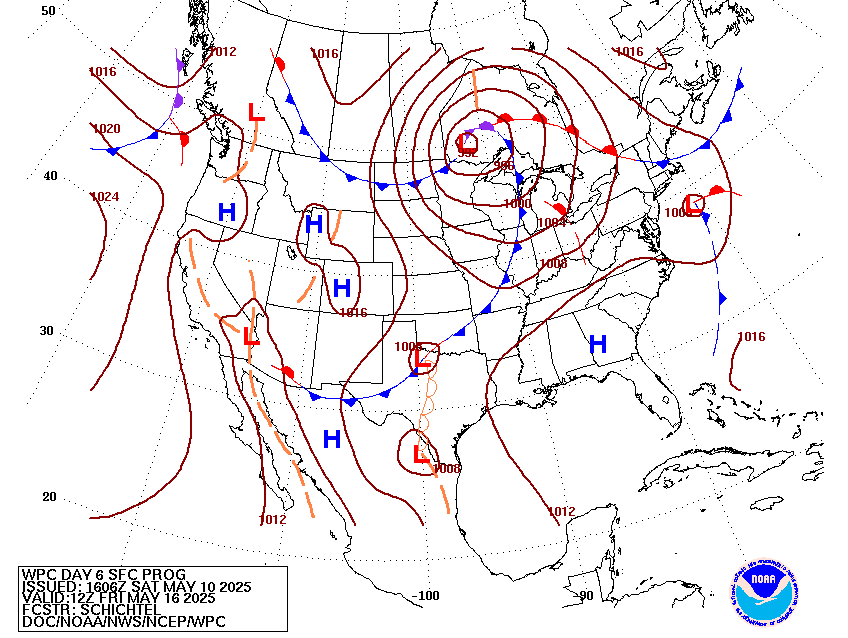
Day 4 image not available
This surface map is valid early Wednesday morning after a cold front moves through (Weather Predictions Center [WPC]). This cold front will be followed by a high pressure system and below normal temperatures.

May Temperature and Precipitation Outlook
As I mentioned before it looks like May will start out slightly below normal. From a new release of the monthly climate prediction from the Climate Prediction Center (CPC), they are predicting around normal temperatures and slightly above average precipitation for the month.

The temperature outlook for the month of May shows near normal temperature for the month of May in Memphis. (NOAA/CPC)

The precipitation outlook for the month of May shows slightly above normal precipitation in Memphis. (NOAA/CPC)

Max Magness
MWN Meteorologist Intern

----
Follow MWN on Facebook and Twitter for routine updates and the latest info!
Complete MWN Forecast: MemphisWeather.net on the mobile web or via the MWN mobile app
Download our iPhone or Android apps, featuring StormWatch+ severe weather alerts!
MWN is a NOAA Weather Ready Nation Ambassador Meteorologist Erik Proseus is an NWA Digital Seal Holder

Sunday, July 17, 2016

Summer 2016 will likely be remembered for unrelenting heat

The summer of 2016 (at least meteorological summer, which consists of June, July, and August) is halfway over, and though not record-breaking, it has certainly been consistently hot!

While Memphis hasn't officially reached 100° yet this summer, perhaps the most notable statistics are related to the unrelenting duration of the heat. We simply haven't caught a break yet this summer! Unfortunately, both the short-term and longer-term forecasts do not offer a lot of hope for those tired of the heat. First, a little more about the heat of the past month and a half...

Summer 2016 Heat Statistics

Last month was the seventh warmest June on record in Memphis as high temperatures averaged nearly four degrees above the long-term average of 88.9° and low temperatures were more than three degrees above the climate average of 70.3°. So far, through the 16th, July has had an average high of 93.2° (1.6° above normal) and an average low of 76.1° (2.3° above normal) for an average temperature for the month that is nearly two degrees above normal.

Speaking of unrelenting, since June 1, the coolest high temperature has been 87°. We are in the midst of a streak of 32 consecutive days with high temperatures at or above 89° that started June 15. In fact, if it weren't for a high of 89° on July 11, that streak would be for temperatures at or above 90°. One additional statistic that speaks to the persistence of the heat is this: since May 24, only four days have had daily average temperatures below normal, and each of those was only 1-2° below normal. Despite all that heat, only two records have been set or tied and both were for warmest daily low temperatures (80° on June 25 and 81° on June 17). I'll say it again, we simply haven't caught a break!

An analysis of the departure from normal temperatures for the past 45 days (since June 2) shows the widespread nature of the warmth across the U.S. with the only below normal temperatures in central TX, along the CA coastline into the Pacific Northwest, along the U.S./Canadian border into New England, and a small portion of the Mid-Atlantic. Graphic courtesy WeatherBell.

Short-Term Forecast

Looking ahead in the short-term, upper level high pressure strengthens across the southern U.S. over the next day or so, then expands northward towards Canada into the Midwest. That means no relief in sight this week from the heat, and in fact, high temperatures on a few days could get near the warmest days so far this year (98° on three days in late June).

The GFS model shows a massive ridge of high pressure at 500mb (or about 18,000') centered over the Plains on Wednesday morning, which is representative of conditions for much of the coming week. Departures from normal conditions are indicated by color shading, with oranges being above normal and blues below normal. The strength of the high pressure indicates suppression of precipitation as weather systems move around the periphery of the high. Graphic courtesy WeatherBell.
The animation below shows the NWS National Blend of Models high temperatures from today through next Saturday. It is easy to see the heat expand as strong high pressure aloft causes the heat at the surface to get more intense. (If the animation doesn't play, click here to view it in a separate window.)


A weak upper-air disturbance will move into the region on Tuesday, perhaps bringing a thunderstorm or two, mainly to west TN, but that should have little effect on the temperatures that day, other than brief cooling for those that receive rain. With high pressure at the surface centered to our east, low level wind will be from the south, and you know what that means - the Gulf of Mexico will be "open for business!"

As moisture streams into the region from the south, expect daily heat indices to be over 100° as highs reach the mid to upper 90s. Some days will see heat indices of 105-110°, necessitating Heat Advisories. Next weekend, a slight weakening of the ridge could mean very low rain chances re-appear. However, if you work outdoors, please take the heat seriously and find time for breaks and drink plenty of water this week. Click here for the detailed week-ahead forecast from MWN, or consult our website or mobile app (links below).

Longer-Term Outlook

As for the long-term, there's actually little hope for the rest of July as that ridge of high pressure will be the dominating force. The NOAA Climate Prediction Center outlook for the past week of July indicates a very strong chance that above normal temperatures continue. Long-range climate models also indicate a likelihood of heat remaining in place to some extent through at least mid-August. It could be interesting to see where the meteorological summer of 2016 ends up when compared to some of the hottest summers on record (as of now, only 1980, 2010, 2011, 2007, and 1954 have been warmer).

NOAA/CPC predicts with high likelihood (nearly 60%) that above normal temperatures will continue from July 24-30. In fact, there is a high likelihood that all of the nation will experience above normal temperatures during this period except the Pacific Northwest.

NOAA/CPC also predicts a better than 50/50 chance that above normal temperatures continue for the first 2 weeks of August across the southern U.S. and west of the Continental Divide.
Stay cool!

Erik Proseus
MWN Meteorologist

----
Follow MWN on Facebook, Twitter, and Google+
Visit MemphisWeather.net on the web or m.memphisweather.net on your mobile phone.
Download our iPhone or Android apps, featuring StormWatch+ severe weather alerts!
MWN is a NOAA Weather Ready Nation Ambassador Meteorologist Erik Proseus is an NWA Digital Seal Holder

Wednesday, August 6, 2014

Do cool Memphis Julys signal a cold and snowy winter?

A question we have been asked a lot recently is what our unseasonably cool July might mean for the upcoming winter. We decided to look at the top 5 coldest Julys in Memphis and each of the following winters to see if there is any connection between cool summers and the following winter. For the sake of this blog, we will examine the total snowfall from November to March and the month with the coldest average temperature. We will also look at how a developing El Nino could play into our forthcoming winter season of 2014-'15.

To establish a baseline, the average monthly temperature for July is 82.7° and the coldest winter month is January with an average temperature of 41.2°.  Seasonal snowfall averages 3.8". Temperature records date back 140 years and snowfall records are spotty before 1889.


2 of the top 3 snowiest winters occurred following a top 4 cool July!

The Top 6

1. 1891 was the coldest July in Memphis history with an average temperature of 77.0° which was followed by a winter in which the coldest month (January) had an average temperature of 36.0° (about 5 degeres below normal) and a seasonal snowfall total of 24”. That year’s snowfall is made up mostly of the largest snowstorm in Memphis history when 18.5” of snow fell in a single storm on March 16th-17th of 1892. Early in March it appeared that winter had come to an end with temperatures climbing into the 60s and low 70s before a strong mid month cold front dropped temps, which was followed a few days later by the historic snowfall.

2. Next on the list comes 1906 with an average July temp of 77.2° followed by a rather mild winter in which our coldest temps came in February of 1907 as average temps fell to 45.2°. That winter only saw 0.7” of snowfall, well below the current normal seasonal snowfall of about 4”.

3. In 1882, Memphis had an average July temp of 77.6° and the coldest winter month (January) saw an average temp of 39.3°. That winter no snowfall was reported, however due to it being pre-1890, snowfall records are very intermittent and therefore it is possible Memphis saw minor accumulations that were never recorded. The data is simply inconclusive.

4. July 1967 is 4th on our list of coldest in Memphis at 77.7° and was followed by a winter dominated by below normal temperatures with the coldest temps coming in February at 37.2°. Total snowfall for the winter of '67-'68 was 23.8”, or 3rd on the list of snowiest winters. Most of the snow fell in the month of March with the second biggest snowstorm in Memphis history. A total of 17.3” fell over three days. The storm got started with 8.7” falling on March 21st before another 7.4” fell on the 22nd and 1.2” fell on the 23rd, bringing the storm to an end.

5. July 1905 had an average temp of 77.9° to come in as the 5th coldest in Memphis recorded history. Average temps for the winter never fell out of the 40s with the coldest month once again coming in February at 41.7°. Snowfall for the 1905-1906 winter season was below normal with exactly 1” spread across December, January, and February.

6. As you might know from reading our posts, July 2014 was the 6th coolest July on record. So the question remains: can we draw any conclusions from Memphis past to suggest what could occur this winter season? Interestingly the top 2 winter storms in our history have followed one of the coolest Julys on record and 2 of the top 3 snowiest winters also followed top 4 cool Julys and the snowiest winter on record (1917-1918) followed a July that was just outside the top 10% of coolest Julys (#17 out of 140 years). But we have also had two years with well below average snowfall and one unknown due to a lack of reliable records. Much like snowfall totals, winter temperatures also seem to be split, featuring two below average seasons, two above average, and one with temps near normal.

The typical winter weather pattern in an El Nino year features a southerly storm track with cool and wet conditions, especially across the southern U.S. All El Ninos are different however.

Influence of El Nino

So what other factors could have an influence on our overall winter pattern? Though it appears it may not be as strong as previously thought, an El Nino is developing, which typically leads to cooler temps and wetter conditions for the southeast U.S. During an El Nino year, low pressure systems typically track along the southern U.S., often south of the metro near the gulf coast, allowing colder air to move into areas north of the system as moisture is pulled northward, overriding the cold air. As is always the case for us, the exact track of each individual storm decides who is dry and cold, who gets a cool rain, and who sees other types of "fun" precipitation (I expect you may be reading that sentence many times this winter). While there are a few interesting correlations, it appears we cannot draw any real conclusions from our past on what we'll experience this winter. One thing you can be sure of is MWN will be here keeping you updated about it across our social media platforms and of course in detail here on the blog!

Patrick Luckett, MWN Social Media Intern

----
Follow MWN on Facebook, Twitter, and Google+
Visit MemphisWeather.net on the web or m.memphisweather.net on your mobile phone.
Download our iPhone or Android apps, featuring StormWatch+ severe weather alerts!
Icicle photo credit: Suat Eman, FreeDigitalPhotos.net

Friday, March 14, 2014

On a cold start to the year, average last freeze dates, and weekend rain


We introduced the MWN Lightning Round about a week ago to provide small bites of weather info that we think would interest our readers.  Today's edition focuses on just how cold it's been so far this year, when (typically) the coldest of the air is behind us, and a quick look ahead at an unsettled weekend.

A cold start to 2014

According to the National Weather Service in Memphis (WebFacebook, Twitter), 2014 is in the Top 10 for coldest starts to a year since 1900.  January averaged just over 5 degrees below normal and February averaged 4.4 degrees below normal, but the first couple of weeks of March have continued the trend, averaging nearly 6 degrees below normal through yesterday.  It's no surprise then that we're moving into the ranks of the coldest years on record, but I didn't realize that it was Top 10 worthy!  Here's the official word from the NWS:


Last freeze dates

Also according to the NWS, we're fast approaching our usual "last freeze date" - or the date that (on average) we see our last 32 degree reading of the spring.  For Memphis, that date is March 19 (and according to the MWN Forecast, we may get close to freezing again on Monday/St. Patty's Day, so that is not unusual).  Though the climate record is not nearly as long, the Agricenter's average last freeze is March 28, so folks in outlying areas especially still have another couple of weeks when a freeze is not at all unusual.  Spring cold fronts often bring a shot of cold, dry Canadian air that can drop temperatures to 32.  The good thing about cold weather in March is that it typically doesn't last long.


Weekend weather

As a perfect segue from the cold weather talk, this weekend's rainy but mild weather will be followed by a brief cold spell. As an example of the typically-brief cold spells discussed above, the low Monday morning will be near freezing, but by Tuesday afternoon we'll be well into the 60s again!  Until then, though, we'll be dealing with a series of disturbances/low pressure systems that will track through the region.  While temperatures in the mid to upper 60s are expected this afternoon and tomorrow, rain (some of it occasionally heavy) will move over late Saturday into Sunday morning.

It appears we may get "dry-slotted" for part of Sunday as the drier area around the low moves overhead, but wrap-around precip will follow Sunday evening and overnight as strong northerly wind picks up and temperatures fall.  We expect all precipitation to be gone by the time the coldest air arrives early Monday morning, but Sunday night could be cool and wet, and definitely breezy!  Highs Sunday will be near 60, but could begin falling on that strong north wind by afternoon.  If you have weekend outdoor plans, get them done on Saturday morning or early afternoon when rain chances are lowest. Again, check out the MWN Forecast for details on this weekend's forecast.

Multi-model average of temperatures through Monday morning. Forecast hours along the bottom, starting at 7am Friday (so 24 = 7am Saturday, etc.), temperature scale along the left. This average shows temps into the 40s by Sunday evening after remaining in the upper half of the 50s Saturday night.

----
Follow MWN on Facebook, Twitter, and Google+
Visit MemphisWeather.net on the web or m.memphisweather.net on your mobile phone.
Download our iPhone or Android apps, featuring StormWatch+ severe weather alerts!

Wednesday, February 6, 2013

January 2013 Climate Data and Forecast Accuracy

Temperatures once again averaged above normal, while precipitation was finally well above normal. Drought conditions continued to abate, even though rainfall was below normal. Northern parts of the metro were still classified "abnormally dry" at the end of the month, however drought was over for the rest of the metro.

There were two strong to severe thunderstorm events.  On January 12-13th, thunderstorms produced flooding in many areas of the metro, while a Moderate Risk event on January 29-30th produced dozens of high wind and flooding reports in our area and a tornado outbreak across middle TN.

Icing also created very hazardous driving conditions on January 14th (0.04") and 15th (0.20").

Memphis International Airport, Memphis, TN

The average temperature for the month of January was 44.9 degrees, or 3.7 degrees above normal. The average high temperature was 53.9 degrees and the average low was 36.0. The coolest temperature of the month was 26 degrees on the 4th and 22nd, while the highest temperature was 76 degrees on the 29th, which also tied a record high for the date. There were 17 days on which the low temperature fell to freezing or below.

Precipitation for the month totaled 9.72", which was 5.74" above average and narrowly missed making the top 10 wettest Januarys on record. It was also the wettest month in Memphis since April 2011. There were 11 calendar days with measurable rainfall; 5 recorded totals of 1" or more (maximum 3.78" on the 29th-30th). Snowfall totaled a trace on January 14th-15th.  The peak wind gust was 61 mph from the southwest produced by a severe storm on the 29th with an average wind speed for the month of 8.1 mph. Click here for a daily statistical recap for Memphis International Airport.

Cirrus Weather Solutions, Bartlett, TN

The average January temperature at Cirrus Weather Solutions was 42.9 degrees with a maximum of 74.9 degrees on the 29th and a minimum of 20.0 degrees on the 3rd. January precipitation measured 7.84" via the Cirrus automated gauge and 8.79" in a manual gauge used for the CoCoRaHS program (which included 0.62" that fell from the afternoon of December 31 through the early morning on January 1). Snowfall recorded was a trace. The measured peak wind gust was 28 mph on the 30th. Average relative humidity was 78%. Click here for a daily recap on MemphisWeather.net.

MWN Forecast Accuracy

For the month of January, the average temperature error in all MWN temperature forecasts was 2.80 degrees, lower than all available full-range computer model data and the National Weather Service. More than 56% of the MWN temperature forecasts for the month were within 2 degrees of the actual temperature. MWN's forecasts extend out five periods (2.5 days, or roughly 60 hours). For dewpoint accuracy, the MWN forecast averaged 3.13 degrees of error and fell within 2 degrees of the actual dewpoint over 51% of the time. Historical accuracy statistics can be found here.

----
Follow MWN on Facebook, Twitter, and Google+
Visit MemphisWeather.net on the web or m.memphisweather.net on your mobile phone.
Download our iPhone or Android apps, featuring a fresh new interface and StormWatch+ severe weather alerts!

Wednesday, January 9, 2013

2012: Warmest Year on Record, in Memphis and the U.S.

Apparently Memphis wasn't the only hot spot in the good ole' USA this year! A just-released report from the National Climatic Data Center (NCDC), a division of NOAA, states that 2012 was the warmest year on record in the continental U.S.
In 2012, the contiguous United States (CONUS) average annual temperature of 55.3°F was 3.3°F above the 20th century average, and was the warmest year in the 1895-2012 period of record for the nation. The 2012 annual temperature was 1.0°F warmer than the previous record warm year of 1998. - NCDC, "State of the Climate"
NCDC goes on to say that preliminary records show 461 recording stations across the CONUS set high temperature records for the year, while 38 stations set a record for minimum precipitation in a year.  Twenty of these station set both records in 2012.


Nineteen states recorded their warmest average temperature on record (those marked "118" in the map below), while all but 3 (Georgia, Oregon, and Washington) of the contiguous states finished in the top 10 warmest for their state.
Nineteen states experienced their warmest year on record, while only 3 states did not crack their top 10 warmest.

Precipitation was also well below normal for much of the country, owing to the drought experienced by a broad swath of the nation that rivaled droughts of the 1950s.  From NCDC's report:
Precipitation averaged across the CONUS in 2012 was 26.57 inches, which is 2.57 inches below the 20th century average. Precipitation totals in 2012 ranked as the 15th driest year on record.
Two states recorded their driest year ever, while a large part of the country experienced well below normal precipitation.
Weather and climate highlights for 2012 include the drought, record heat, wildfire activity, well below normal annual tornado count following an active spring, and two significant tropical (or post-tropical) landfalls in Isaac and Sandy. Below is a summary of the major events of 2012:


For the complete NCDC report containing a great deal of detail on events and records of 2012, read the State of the Climate report, or the Summary of the SOTC report.

----
Visit MemphisWeather.net on the web or m.memphisweather.net on your mobile phone.
Download our iPhone or Android apps, featuring a fresh new interface and StormWatch+ severe weather alerts!
Nowcasting services available on our Facebook page and Twitter feed.

Saturday, November 24, 2012

MWN 2012-2013 Winter Outlook for the Mid-South

Winter outlooks are always a tricky endeavor here in the Mid-South.  In fact, I'll be honest, I don't like doing them, but they seem to be popular among our readers so I put them together each year with some hesitation.

In the interest of full disclosure, I'm not a long-range forecaster.  I specialize in nowcasting.  So while I can hold my own in the 0-6 hour time frame (and am not too shabby when it comes to 5-7 day forecasts), 3 month outlooks are a challenge.  What I can do is cull information from multiple sources, put it in the blender, add a dash of experience and knowledge in Mid-South weather patterns, and present it in a coherent manner.

Note that while this discussion is heavy on the effects of large-scale patterns that help determine winter weather regimes across the U.S., and specifically the Mid-South, I do offer my thoughts on what to expect locally, this winter, at the end of the post. Skip ahead to "The Bottom Line" if you wish.

Last year's MWN outlook

At this time last year, I predicted near normal temperatures and precipitation, a couple of chances at winter precipitation, and also a few shots at severe weather late in the winter.  As it turned out, temperatures were in the top 10 for warmth, precipitation was very close to normal, and most of the snow that we received was early in the season (late November-early December, before it got excessively warm) with one brief snow event around Valentine's Day.  Severe weather struck on January 22 and the Memphis area just missed large-scale events on February 29 and March 2 (both exploded just to our east).  Except for the miss on temperatures, I pretty much had the winter pegged!

Status of ENSO / Recent Mid-South Winters

The driving factor in most winter outlooks for the U.S. is the status of El Nino-Southern Oscillation (ENSO), which is somewhat predictable out at least a few months.  ENSO refers to variations in the temperature of the surface of the tropical eastern Pacific Ocean and in air surface pressure in the tropical western Pacific.  These variations can bring somewhat predictable patterns to the weather in North America.  For instance, El Nino during the winter is associated with a more southerly track to the jet stream as it enters North America's western coast, resulting in stormy weather for California and much of the southern U.S.

The past few years have seen La Nina conditions the past two winters (2011-'12 and 2010-'11), El Nino in 2009-'10, and ENSO-neutral (or La Nada) in 2008-'09.  Here's how Mid-South weather has responded:
  • 2008-'09 (La Nada) - snowy (3.8" at the airport, 8.9" at MWN in Bartlett), temps/precip slightly above normal
  • 2009-'10 (El Nino) - 13th coldest winter on record, snowy (6.8"), precip slightly below normal
  • 2010-'11 (La Nina) - 8th driest winter on record, but 9.7" of snow; temps just above normal
  • 2011-'12 (La Nina) - 7th warmest winter on record, dry with little snow
Looking ahead to the winter of 2012-'13, one thing we know (or are fairly certain of) is that earlier predictions of an El Nino winter now appear to be fizzling and long-range models are nearly unanimous that an ENSO-neutral, or "La Nada" (neither El Nino nor La Nina), pattern will be present.  Looking back, the last ENSO-neutral pattern brought slightly above normal temperatures and precipitation and some snow of note (2008-09).

Typical effects of an ENSO-Neutral winter. Note the presence of a subtropical jet stream over the Mid-South.

The NOAA Winter Outlook

In fact, the "official" winter (December-February) outlook from the National Weather Service/NOAA for the Mid-South predicts a better chance of above normal precipitation (40%) than below normal (27%) (see second figure below).  From a temperature standpoint, equal chances of above and below normal temperatures are forecast, though above normal temperatures are likely across a large area just to the west of the Mid-South (first figure below).  NOTE: Not shown, higher chances of above normal temperatures are forecast heading into spring 2013, which could translate into late winter (Feb-Mar) as well.

Chances of above (A) and below (B) normal temperatures for Dec-Jan-Feb from NOAA/NWS.
Un-shaded areas have equal chances of above and below normal average temperatures.

Chances of above (A) and below (B) normal precipitation for Dec-Jan-Feb from NOAA/NWS.
Un-shaded areas have equal chances of above and below normal average precipitation.

Other factors, and their effects

Besides ENSO, there are several other factors that are much less predictable, especially beyond a week or two, that can have major influences on the weather pattern over North America.  To see the effects of one of the major players, look at the difference between the last two winters - both of which featured La Nina conditions.  2010-'11 had decent snowfall (9.7" officially), but was very dry when considering rainfall.  Last year was very warm with near normal precipitation and very little snow (all of it early in the winter).

The difference between these two winters was the strong influence of the NAO, or North Atlantic Oscillation.  The NAO changes based on the position and strength of the North Atlantic jet stream.  A positive NAO brings above normal pressure to the eastern U.S., which tends to result in above normal temperatures that can extend into the Mid-South. A negative NAO results in lower pressure along the Atlantic seaboard and below normal temperatures, as well as more general storminess, in the eastern U.S.

The winter of 2010-'11, which was a La Nina winter, resulted in several periods of cold and snowy conditions due to a persistent negative NAO.  The winter of 2011-'12 was influenced by NAO but was overcome in this region by one of the strongest La Ninas in recent memory, resulting in warm and dry conditions across the southern U.S. The negative NAO's effects were more pronounced along the eastern seaboard.  The NAO can vary several times over the course of a winter and is generally not predictable beyond a week or two in advance.  Thus it is a huge factor whose effects for a season cannot be accurately determined this far in advance.
Effects of the NAO in it's positive and negative phases (Image credit: Brad Panovich)

Another global factor is the Arctic Oscillation (AO), which produces similar results to the NAO - colder in the eastern U.S. when negative, warmer and drier when positive.  The AO is also unpredictable, though there are early signs that the AO could be in a more negative phase than positive at least early in the winter.  The AO was negative for much of the 2009-'10 (El Nino) and 2010-'11 (La Nina) winters, contributing to brutal winter storms over the eastern U.S. and near to above normal snowfall both winters in the Memphis area, despite an overall dry winter last year.

Effects of the AO in it's positive and negative phases (Image credit: Brad Panovich)

The bottom line

While we expect to see an absence of official El Nino or La Nina conditions, Pacific Ocean temperatures slightly favor El Nino warmth.  Couple this with the possibility of negative NAO and AO conditions over the North Atlantic and it's prudent to follow the NOAA experts in calling for a better chance of above normal precipitation than below normal here in the Mid-South.  These factors all indicate that, one way or the other, the region could be squarely in the path of a number of varying storm tracks.

However, temperatures (as everyone knows who has lived here for any length of time) are the biggest forecasting dilemma, even a day or two in advance of a winter low pressure system.  Frequently, the Mid-South sits right on the edge of temps that are cold enough (to the north) or too warm (to the south) to produce snow from passing winter weather systems (think "I-40 corridor").  I think that will continue to be the case this winter (which is not going out on a limb per se).

But, the chance of having more wet systems moving through the region gives us the potential for additional chances that cold air could be in place at just the right time to produce some snowfall.  I expect more snow than last year, but not necessarily enough to go down in the record books.

Lastly, given above normal precipitation and a more active storm track, as well as possible above normal temperatures, I also give the Mid-South a slightly elevated chance of experiencing severe weather, especially late in the winter.

MWN Winter Outlook for 2012-2013

Temperatures near to slightly above average
Precipitation - above average
Snowfall - near to just below average (average is 3.6")
Severe weather - slightly elevated chances

We'll see how it plays out and you can call me a liar when the official stats come in next spring!  Just be sure to re-read the disclaimer at the beginning of this article before calling me out...  However it pans out, MemphisWeather.net WILL keep you updated on each system that affects the region throughout the winter, just as you have come to expect.

Erik Proseus, Meteorologist
Cirrus Weather Solutions/MemphisWeather.net


References: 
El Nino - http://en.wikipedia.org/wiki/El_Ni%C3%B1o%E2%80%93Southern_Oscillation
NOAA/CPC seasonal outlooks - http://www.cpc.ncep.noaa.gov/products/predictions/90day/
NCAR/UCAR - "Hola La Nada!" - https://www2.ucar.edu/atmosnews/opinion/8297/hola-la-nada
NOAA/CPC - Teleconnections - http://www.cpc.ncep.noaa.gov/products/precip/CWlink/daily_ao_index/teleconnections.shtml
2012-'13 Winter Outlook by Brad Panovich (image credit) - http://wxbrad.com/8th-annual-winter-forecast-2012-2013/

----
Visit MemphisWeather.net on the web or m.memphisweather.net on your mobile phone.
Download our iPhone or Android apps, featuring completely updated interfaces and StormWatch+!
Nowcasting services available on Facebook and Twitter.

Thursday, June 21, 2012

Long-lead temperature forecasts indicate a hot Mid-South summer is likely

NOAA's Climate Prediction Center released their updated temperature probability outlooks today.  Below are the outlooks for July 2012 and the July-August-September period.  The tan colors indicate temperatures above normal are more likely than temperatures below normal. Light blue colors indicate temperatures below normal are more likely than temperatures above normal.


To decipher, consider first that in a "normal" regime, there is a 33% chance of above, near, or below normal temperatures. Inside the 33% outlook area (light tan) there is a better than 33% chance of above normal temperatures and a subsequent reduction in the chance that temperatures will be below normal (the chance of "normal" temps remains fixed at 33%). In the case of a 50% above normal area (dark orange), there is a 50% chance of above normal temps, a 33% chance of normal temps, and a 17% chance of below normal temps.

The primary drivers of these forecasts for above normal conditions are the return of ENSO neutral conditions (neither El Nino or La Nina) this summer, dry soil moisture conditions (which promotes heating), recent trends, and long-range climate models favoring above normal conditions. 

The Memphis metro is in the 33% area for July and 50% area for the July-September average.  In other words, if this long-range forecast verifies, we can expect a long hot summer!  

For more information and the remainder of the outlook maps, including precipitation outlooks and outlooks for further into the future, visit the CPC website.

----
For weather information for Memphis and the Mid-South, where and when you need it, visit MemphisWeather.net on the web, m.memphisweather.net on your mobile phone, download our iPhone or Android apps, or visit us on Facebook or Twitter.

Monday, October 3, 2011

September 2011 Climate Data and MWN Forecast Accuracy

With one of the hottest summers on record in Memphis in the history books (3rd warmest behind 1980 and 2010), a welcome change arrived in September - temperatures averaged below normal for the month! After temperatures of 96 or higher the 1st through 3rd, fall arrived with only two 90+ degree readings the rest of the month. Precipitation was also slightly below average. No daily records were broken during the month.

Memphis International Airport, Memphis, TN

The average temperature for the month of September was 73.3 degrees, which was 1.9 degrees below normal and over 10 degrees cooler than August. The average high temperature was 83.6 degrees and the average low was a pleasant 62.9. The coolest temperature of the month was 55 degrees on the 7th and again on the 27th, while the highest temperature was 99 degrees on the 1st.  There were just 5 days in which the high temperature reached at least 90.

Precipitation for the month totaled 2.56", which was 0.53" below average.  There were just 5 days with measurable rainfall and most of that fell on 2 days that measured more than one inch each (the 19th and 25th). The greatest 24-hour total was 1.32" on the 25th. The peak wind gust was 39 mph on the 14th with an average wind speed for the month of 6.8 mph. Click here for a daily statistical recap for Memphis International Airport.

Cirrus Weather Solutions, Bartlett, TN

The average September temperature at Cirrus Weather Solutions in north Bartlett was 69.9 degrees with a maximum of 99.2 degrees on the 1st and a minimum of 48.2 degrees on the 9th. September precipitation was about an inch more than the Memphis airport, totaling 3.50". A co-located manual gauge used for the CoCoRaHS program measured 3.70". The peak wind gust was 28 mph on the 5th. Average relative humidity was 70%. Click here for a daily recap on MemphisWeather.net.

MWN Forecast Accuracy

For the month of September, the average temperature error in all MWN temperature forecasts was 2.22 degrees, lower than all compared computer models, including the NWS. Nearly 65% of the MWN temperature forecasts for the month were within 2 degrees of the actual temperature. MWN's forecasts extend out five periods (or 2.5 days). For dewpoint accuracy, the MWN forecast beat all data sources, averaging 2.42 degrees error and falling within 2 degrees of the actual dewpoint 62% of the time. Historical accuracy statistics can be found here.

----
For weather information for Memphis and the Mid-South, where and when you need it, visit MemphisWeather.net on the web, m.memphisweather.net on your mobile phone, download our iPhone or Android apps, or visit us on Facebook or Twitter.

Saturday, September 3, 2011

August 2011 Climate Data and MWN Forecast Accuracy

While the June-July period averaged 84.9 degrees (tied with 1980 as the warmest June-July on record in Memphis), August's temperatures were slightly cooler than July overall and brought the "summer of 2011" average temperature down slightly to 84.6 degrees, which ranks as the 3rd hottest summer in recorded Memphis history behind 1980 and 2010. Record temperatures for the month are listed in the table below, followed by the Top 5 warmest summers. Precipitation was near average for the month.

DateRecordTemperature
(T=tied)
August 1Maximum Low83° F
August 2Maximum Low81° F
August 2Maximum 101° F
August 3Maximum 106° F
August 23Maximum80° F (T)

Top 5 Warmest Summers in Memphis (June/July/August)
1. 1980 - 85.6° F
2. 2010 - 85.4° F
3. 2011 - 84.6° F
T4. 1954 - 84.2° F
T4. 2007 - 84.2° F

Memphis International Airport, Memphis, TN

The average temperature for the month of August was 83.9 degrees, which was 1.9 degrees above normal and just over 2 degrees cooler than July. The average high temperature was 93.0 degrees and the average low was 74.9. The coolest temperature of the month was 67 degrees on the 15th and the highest temperature was 106 degrees on the 3rd.

Precipitation for the month of August totaled 3.08", which was 0.20" above average. Climatologically, August is the driest month of the year in Memphis.  There were 9 days with measurable rainfall; 3 of those measured more than one-half inch.  The greatest 24-hour total was 0.85" on the 20th-21st. The peak wind gust was 52 mph in a thunderstorm on the 12th with an average wind speed for the month of 6.0 mph. Click here for a daily statistical recap for Memphis International Airport.

Cirrus Weather Solutions, Bartlett, TN

The average August temperature at Cirrus Weather Solutions in north Bartlett was 81.2 degrees with a maximum of 105.1 degrees on the 3rd and a minimum of 59.9 degrees on the 15th.  August precipitation was about half an inch less than the Memphis airport, totaling 2.51". A co-located manual gauge used for the CoCoRaHS program measured 2.42". The peak wind gust was 25 mph on the 12th. Average relative humidity was a high 72%. Click here for a daily recap on MemphisWeather.net.

MWN Forecast Accuracy

For the month of August, the average temperature error in all MWN temperature forecasts was 2.88 degrees, lower than all compared computer models and the NWS by 7% or more. Over 50% of the MWN temperature forecasts for the month were within 2 degrees of the actual temperature. MWN's forecasts extend out five periods (or 2.5 days). For dewpoint accuracy, the MWN forecast beat all data sources, averaging 2.36 degrees error and falling within 2 degrees of the actual dewpoint nearly 60% of the time. Historical accuracy statistics can be found here.

----
For weather information for Memphis and the Mid-South, where and when you need it, visit MemphisWeather.net on the web, m.memphisweather.net on your mobile phone, download our iPhone or Android apps, or visit us on Facebook or Twitter.

Monday, December 27, 2010

Pattern shift means warmer and stormier in the Mid-South

It's been a cold December f0r the Mid-South with an average temperature of 39.1 degrees at Memphis International Airport, or nearly 5 degrees below "normal," and 19 days with lows at or below freezing. The good thing about the cold weather is that it was in place as low pressure moved by to our south and a cold front came through, bringing snowflakes on Christmas weekend. In fact, many places east of the Mid-South, including northern AL, southeast TN , and northern GA, saw a few inches of snow on Christmas Day. That storm then turned into a major Nor'Easter that is bringing blizzard conditions to the Northeast, dumping snow measured in feet from New York City to Boston. (Incidentally, it's also the same system that flooded southern California, Nevada, and Utah last week.)

Pattern Shift
A shift is now in the process of occurring that will transition the overall weather pattern over North America (and even parts of Europe, where snow has also crippled travel and commerce for a couple of weeks). The new pattern will resemble more of what meteorologists are used to seeing in La Nina winters, in which the jet stream flows on a more northerly track. That will bring storms across the northern tier of the U.S. and into the Ohio Valley rather than across the southern U.S. and will mean warmer weather (generally) for the southern U.S., but also chances for a more stormy pattern. Rainfall has been well below normal for the month of December in the Mid-South, but that could change over the next couple of weeks. (More on the global pattern shift can be found on Weather Underground blogger Jeff Master's post from earlier today, in which he also recaps the East Coast Blizzard. It's worth a look.)

Repercussions for the Mid-South
As the trough currently over the eastern U.S. moves over the Atlantic, a new trough will form over the west and begin moving towards the area. Ahead of the trough, surface high pressure will move to our east, bringing wind around to the south by tomorrow and starting a fairly significant warm-up. One piece of energy will move through on Wednesday as a warm front lifts north, bringing high chances of rain during the day. Moist southerly flow will continue Thursday as a couple of low pressure systems begin moving north-northeast through the Plains. A chance of showers will exist in the Mid-South, but mainly it will be much warmer (highs of 60+) and breezes will pick up. For New Year's Eve, a frontal system will move across the region, bringing another round of rain. With the right dynamics in place, thunderstorms could also be likely with a few possibly strong to severe. The map below shows the current probability of precipitation for Friday night (6pm Fri until 6am Sat).


Plan ahead
There are many parameters that are still unknown at this point, but those with plans, particularly outdoors, on New Year's Eve (day or evening) should monitor this system carefully and watch for later statements or advisories. That would include those attending the Liberty Bowl game featuring SEC powerhouse Georgia and Conference USA champ Central Florida and also those heading downtown to Beale Street for New Year's Eve celebrations. At the very least, plan to have umbrellas or ponchos handy (not sure if umbrellas are allowed in the stadium or not). Heavy rain is definitely a strong possibility, even if severe weather is not.

MemphisWeather.net will keep you abreast of the latest forecasts and conditions, as will this blog, and MWN on Facebook and Twitter. Now would be a good time to sign up for severe weather alerts by e-mail for any of the metro counties or follow @shelbyalerts on Twitter for weather alerts for Shelby County. These services pass the info directly on to you as soon as they are received from the National Weather Service.

Top 10 Weather Events of 2010
Finally, I'll also direct you to one last article that you should check out. Friend and blogger Paul Yeager of CloudyandCool.com and AOLNews contributor recaps the Top 10 (U.S.) Weather Events of 2010. I strongly agree with #1, which happened to directly impact the Memphis metro area... can you guess?

----
Get the latest weather conditions and much more by checking out MemphisWeather.net on Facebook and Twitter!

Friday, October 1, 2010

September Climate Data and MWN Forecast Accuracy

Memphis International Airport, Memphis, TN
September typically marks the transition from the heat of a Memphis summer to the much more pleasant conditions of fall. While that transition did take place this month, it was much later in than any Mid-Southerner could have hoped for, especially after a very long and hot summer. Multiple high temperature records were again broken in September, including a week-long stretch of record heat from the 18th to the 24th, including the latest 100 degree day in recorded history, reached on September 20. Finally, on the 25th, an autumn cold front moved through and brought an end to the "Summer of 2010!" In addition, very dry conditions persisted and parts of the metro area were classified as being in a "moderate drought" by the end of the month.

For the month, the average temperature was 79.1 degrees, which was 4.3 degrees above normal. The average high temperature was 90.6 degrees and the average low was 67.7, with 19 days reaching a high of at least 90. Typically, only 7 days in September reach 90 degrees (making the average high of 90.6 even more incredible). The maximum temperature for the month was 100 degrees on the 20th and the lowest was 54 on the 28th.

Precipitation for the month of September totaled only 0.14", or 3.17" below normal, making this month the 3rd driest September on record, trailing only 1928 [0.06"] and 1897 [0.00"]. There were just 6 days with measurable rainfall, the maximum one day total being just 0.06". There were no days in which thunder was recorded. The peak wind gust was 37 mph on the 16th, while the average wind speed for the month was 6.9 mph. Click here for a daily statistical recap for September.

Bartlett, TN
Bartlett also saw a very warm and dry month. The average temperature for September at the WXLIVE! station in north Bartlett was 75.1 degrees with a maximum of 98.2 on the 20th and a minimum of 45.7 degrees on the 28th.

September precipitation ended up well below normal with a precipitation total of 0.12" and only 4 days of measurable rainfall. A co-located manual gauge used for the CoCoRaHS program measured 0.13" in September. The peak wind gust was 23 mph on the 16th. Average relative humidity was 65%. Click here for a daily statistical recap on MemphisWeather.net.

MWN Forecast Accuracy
For the month of September, the average temperature error in all MWN temperature forecasts was only 2.06 degrees, beating all compared computer models, including the National Weather Service, by 10% or more. Nearly 65% of the MWN temperature forecasts for the month were within 2 degrees of the actual temperature. MWN's forecasts extend out five periods (or 2.5 days). For dewpoint accuracy, the MWN forecast was also the best of the data sources at 2.45 degrees average error and was within 2 degrees of the actual dewpoint nearly 65% of the time. More detailed accuracy statistics can be found here.

----
Get the latest weather conditions and much more by checking out MemphisWeather.net on Facebook and Twitter!

Thursday, February 25, 2010

Top 10 - Streaks of sub-70 degree temps

The last 70 degree day in Memphis was November 15, 2009, or 102 days ago. This streak puts the city in the top 10 for consecutive number of days below 70 and the longest such stretch in 74 years. Listed below are the top ten longest stretches since records began in 1875. This winter season now ranks 9th in the list. (By the way, I fully expect this streak to continue for some time, as there are no signs of a pattern shift that will support 70 degree weather anywhere in the near term.)

Rank # days End date
==== ====== ========
1. 140 4/4/1915
2. 133 4/2/1931
3. 122 3/15/1877
4. 121 3/17/1912
5. 114 3/15/1886
6. 114 3/10/1885
7. 111 2/28/1908
8. 104 2/23/1936
9. 102 2/25/2010
10. 101 2/28/1905

----
Get the latest weather conditions and much more by checking out MemphisWeather.net on Facebook and Twitter!

Sunday, January 17, 2010

A pattern shift in the making

My apologies for having taken some time off from the blog after the recent Arctic outbreak. I guess I was thawing my fingers. The finger-thawing weather will continue for the foreseeable future, though with some temps in the 60s the past few days, I don't think there is any thawing left to be done!

While temps averaged over 15 degrees below normal for the first 10 days of January, highs have rebounded into the mid 50s to lower 60s the last 4 days and the forecast points to more of the same for at least the next week. Also of note, yesterday and today's rainfall of between 1.0-1.5" was the first rain of 2010, a full 16 days into January! Of course, we can't forget the few hundredths of an inch of liquid precip we picked up with the snow on January 7, but this was the first rain since December 31. This marks the latest "first rain day" to start a year in at least 15 years, which is how far my available records go back.

Looking ahead, following the Arctic intrusion that blanketed the eastern half of the nation to start the year, we are now in the midst of a "pattern shift" which will signal a significant change in U.S. weather patterns over the coming couple of weeks perhaps. During the first two weeks of January, the upper level pattern was marked by a large scale trough (upper level low pressure) over the eastern U.S. and a ridge over the west (upper level high pressure) (see graphic of the upper-level pattern on January 5, courtesy Storm Prediction Center, above).

Gradually that pattern has shifted to something more akin to El Nino years. We now will be seeing a flatter upper level pattern (lower amplitude troughs and ridges) with a strong jet stream pointed straight into the southwestern U.S. and northwestern Mexico (see graphic above valid mid-week; click for larger version). This pattern will mean frequent and strong storms for California, which will then move across the southern Rockies, southern Plains, and into the southeast U.S. More benign weather, outside of clipper systems from Canada, are expected across the northern tier of the U.S. So, if you are watching The Weather Channel or even national news, you'll definitely be seeing stories on the emergence of an El Nino weather pattern and probably flooding and mudslides in southern CA and feet upon feet of snow for the Sierra range. For more on the pattern shift and effects on our west coast neighbors, see Paul Yeager's excellent post "Storms to Blast California."

For the Mid-South, this will mean milder weather with storm systems approaching from the west or southwest that will bring rain every few days and perhaps setting the stage for one or more of these systems to bring the threat of some thunderstorms. The milder weather is due to the fact that these storms will be of Pacific origin and not Canadian origin. Between systems, with some sun, temperatures will have no problem reaching the 50s and 60s and overnight lows should remain "mild for January." More details will be found in the forecasts posted on MemphisWeather.net.

----
Get the latest weather conditions and much more by checking out MemphisWeather.net on Facebook and Twitter!

Monday, November 23, 2009

Climate trends, El Nino, and waterfowl

I have seen several interesting weather items of note in the past couple of days that I thought I would touch on today. Here they are, in decreasing scale order (globally to locally):

October Climate Stats
While the U.S. experienced its wettest, and third coolest, October in recorded history, that didn't bear out across the rest of the globe. NCDC indicates, and Dr. Jeff Masters of Weather Underground reports, that last month was the 6th warmest October on record globally. In the U.S., temperatures averaged 4.0F below normal, while precipitation was almost double the typical October average. It appears from the graphic above that outside of the continental U.S., northern Europe was the only other region where temps averaged below normal. In addition, U.S. drought and fire activity both decreased in October.


El Nino Strengthens
According to the Climate Prediction Center's (CPC) weekly El Nino report issued this morning, El Nino conditions have strengthened across the central and eastern Pacific in the past month, with sea surface temperatures now averaging 1.0-2.0 degrees above normal. In fact, the most watched region of the Pacific (dubbed "El Nino 3.4") has now crossed a threshold that allows this El Nino event to be classified a "strong" event. Model forecasts call for moderate to strong El Nino conditions to continue through the 2009-2010 Northern Hemisphere winter. Three-month forecasts for the Mid-South reflect semi-typical El Nino considerations, including slightly below normal temperatures and below normal precipitation. More on the current El Nino conditions can be found here.


Another Winter Forecast
My blogosphere friend Paul Yeager of CloudyandCool.com wrote yesterday about a computer model called the NCEP coupled forecast system (CFS) that has advantages over typical day-to-day models in forecasting long-range (read Paul's blog for a great explanation). In the FWIW category, the CFS output agrees with the CPC and most other winter forecasts that have taken into consideration the effects of El Nino and forecasted cool and dry winter months for the Mid-South. For a look at U.S. temperature forecast maps from the CFS, click here, and for precipitation, click here.


Doppler Ducks
Ryan Vaughan with KAIT-TV in Jonesboro woke up Saturday morning to reports of large flocks of waterfowl (likely geese and some ducks) flying south over northeast AR. As he checked NWS Doppler Radar, he noticed what appeared to be light rain showers headed south over the area (while other returns were moving northeast through north MS). Putting two and two together, it was determined that the migratory birds were showing up on radar! (Read more on Ryan's blog, including a radar loop of the occurrence.)

While a very cool thing to witness, birds on radar is certainly not unprecedented (see my previous blog, "The Birds"). In fact, during certain times of year, at sunrise, "expanding donuts" of radar echoes appear near Reelfoot Lake and other areas around the region known to be excellent sleeping spots for our feathered friends. As the waterfowl take off in all directions, they show up as an ever-expanding ring of echoes.

So hunters, not only will checking the early morning forecast on MemphisWeather.net be helpful in determining the weather conditions for your stakeout, but accessing Doppler radar on MWN Mobile might net you a heads-up to an approaching flock!

----
Become a fan of MemphisWeather.net on Facebook and follow MWN on Twitter!

Saturday, November 14, 2009

Why "normals" don't necessarily always seem normal

I make it a practice to almost never use the word "normal" when referring to temperature and precipitation trends. Even though it is a widely used term in Meteorology and Climatology, I prefer the more mathematically correct term "average." As far as I am concerned, there is nothing normal about a weather pattern that changes every day, no matter how minuscule the change may seem.

The latest weather patterns in the Mid-South are a good example. 2009 has been, overall, a very wet year for the region. In fact, last month ended up as the wettest October on record in Memphis. After recording 14 days of measurable precipitation for the month, the city went over its climatological "normal" precipitation for the year by the end of October, which means anything we get from November 1 until the end of 2009 just adds to the "wetter than normal" yearly total.

The problem is, since October 30, the city hasn't recorded a drop of rain. As of Sunday the 15th, the dry spell will reach 16 days, which will be the second longest dry spell of the year behind an 18 day streak from June 16-July 3. Our dry streak will likely end on Monday as a cold front moves in, but very wet spells, like September and October are often balanced by periods like we have just been through and the last part of June and August, which were exceptionally dry.

In sum, though 2009 will end up with above average precipitation, dry and wet spells can make a normal year seem unusual!

----
Become a fan of MemphisWeather.net on Facebook and follow MWN on Twitter!