Showing posts with label education. Show all posts

Wednesday, February 28, 2018

Severe Weather Awareness 2018: Tornado Safety

The El Reno, OK EF-3 tornado of May 31, 2013, taken from about one mile away by storm chaser Nick Hellums.
Tornadoes are violent columns of rotating air that are produced by severe thunderstorms.  Weak tornadoes produce wind of  65-85 mph, while the strongest (such as the Moore, OK tornado of May 2013), produce wind well over 200 mph and can be a mile wide or larger (the El Reno, OK tornado of May 2013 is the widest on record at 2.6 miles!). Not all severe thunderstorms produce tornadoes, only a small fraction do, but people should be alert for the possibility if and when a Severe Thunderstorm Warning is issued and take action when a Tornado Warning is issued for their location.

Tornado safety rules include:
  • At home or in small buildings, go to the basement or storm shelter, or to a windowless interior room such as a closet or bathroom on the lowest level.  Get under something sturdy such as a table or heavy bed.
  • Abandon mobile homes and vehicles for a sturdy structure. If there is no such structure nearby, lie flat in a ditch, ravine, gully, culvert, or a low spot with your arms and hands shielding your head, staying mindful of possible flooding as well.
  • In large buildings such as at school, shopping centers, hospitals, or factories/warehouses, go to the predesignated shelter area. Interior hallways on the lowest floor are best. Stay out of areas with high roofs or large roof spans, as they typically offer little to no protection from tornadic wind due to weakly supported roofs.
  • At school, children should follow the safety procedures established by school officials. These should include avoidance of areas with high roof spans and glass exposed to the exterior of the school. Children should crouch down next to a wall or under desks or tables and cover the head and neck with their hands.
  • At all times, avoid windows or large panes of glass.
  • If outside and sturdy structures are not available, try to drive to the nearest sturdy structure for shelter.  If one is not available, lie down in an area that is lower than surrounding areas (ditch or ravine if possible) with arms/hands shielding your head (being mindful of potential flash flooding).
  • When taking cover, have shoes on, photo ID on your person, cell phone (preferably charged in advance) with you, and crouch down and protect the back of your neck with your arms and hands.

A Tornado Watch, typically issued for a large area such as several counties, means that conditions are favorable for the development of severe thunderstorms that can produce tornadoes. Stay tuned to NOAA Weather Radio, commercial TV or radio, and other trusted sources for warnings and watch the sky for the possibility of developing severe weather.  Have your plan ready should a warning be issued and be ready to exercise that plan on a moment's notice.

A Tornado Warning, typically issued for a small area in the path of a storm, means that Doppler Radar has indicated the likelihood of a tornado or a tornado has been sighted by spotters or law enforcement.  If you are in the path of the storm (sometimes called "in the polygon" due to the shape of the warnings that are drawn by the NWS), immediately find shelter using the rules above.

A Tornado Emergency is not a warning type, but is issued (usually following the original Tornado Warning) when a large and destructive tornado has been confirmed and is moving into a populated area.  The risk of destruction and fatalities is high and an elevated call-to-action is required.  Everyone in the storm's path should immediately take action.

Storm Shelters

MWN recommends Take Cover Storm Shelters to keep Mid-South residents safe in the path of the storm. We have become very familiar with Take Cover's high-quality products, as well as their outstanding customer service, and have no reservations about endorsing this fantastic company. You can learn more about Take Cover Shelters and their in-ground shelters, which are installed in a concrete slab such as a garage floor, at their website or on Facebook. Be sure to mention MemphisWeather.net when you contact Jessica!

StormWatch+ Alerts

In addition, a personal warning device that only alerts you if YOUR location is in the path of a dangerous storm is a MUST. We encourage you to add StormWatch+ to your MemphisWeather.net app. It will wake you up at night for the most dangerous situations and allow you to customize exactly what locations you want to be alerted for and what types of alerts to receive, as well as when you don't want to be bothered.  The MWN mobile app is available for iPhone and Android devices.

For more information and interesting statistics on Mid-South tornadoes, see this recent study and this comprehensive overview produced by NWS-Memphis. Graphics below published in the second link listed.

Mid-South tornadoes by month. The primary season is spring, but a secondary season exists in the fall. Tornadoes can occur in any month however. Courtesy NWS-Memphis.

Mid-South tornadoes by hour of the day. Most tornadoes occur in the late afternoon to early evening, though they can occur at any time of day. In fact, 46% of Mid-South tornadoes occur at night, which contributes to a high death rate. Courtesy NWS-Memphis.

----
Follow MWN on Facebook, Twitter, and Google+
Visit MemphisWeather.net on the web or m.memphisweather.net on your mobile phone.
Download our iPhone or Android apps, featuring StormWatch+ severe weather alerts!
MWN is a NOAA Weather Ready Nation Ambassador Meteorologist Erik Proseus is an NWA Digital Seal Holder

Wednesday, May 24, 2017

GOES-16: A Weather and Climate Game-Changer


When it comes to weather forecasting, meteorologists are often only as good as the technology and data they have access to. Perhaps one of the greatest leaps forward for the weather enterprise in the 21st Century is not even on this planet, but rather orbiting well above it. One satellite has the capability of changing how we see many facets of our atmosphere.

GOES-16, the satellite formerly known as GOES-R, is the latest and greatest in a long line of weather satellites placed into orbit by the United States. (Geostationary satellites use a letter designation prior to reaching orbit, then switch to a number once reaching orbit.) Launched back on November 19, 2016, the satellite has been undergoing a number of post-launch tests for the past several months. The plan is for GOES-16 to be providing its full suite of data and imagery in the coming month or so, with certification to be "fully operational" before the end of 2017. In the meantime, some non-operational or “unofficial” data is available, leaving many atmospheric scientists gawking and giving hope that this new generation of satellites will further expand our knowledge of weather and climate, both on earth and in space.

The GOES-16 satellite is equipped with many new pieces of technology that separate it from its predecessors. The Advanced Baseline Imager (ABI) is the "camera" that points towards earth and contains many more than 3 times as many imagery bands, or channels, as the current GOES satellites. Meanwhile, perhaps the most unique new tool aboard GOES-16 is the Geostationary Lightning Mapper (GLM), which will allow scientists to gain a new perspective of where lightning occurs via a sensing platform in geosynchronous orbit over the western hemisphere.

The GOES-16 satellite system has five unique instruments for sensing the environment, from space to earth. Three of those are for monitoring space weather and the other two (the Advanced Baseline Imager [ABI] and the Geostationary Lightning Mapper[GLM]) sense the atmosphere surrounding the earth. (Image courtesy: NASA)
Satellite data is incredibly valuable to meteorologists as it provides a unique perspective of our weather and planet. While ground-based instrumentation is important, that merely allow us to observe what is occurring at the surface, as with weather stations, or in the lowest several thousand feet of the atmosphere with radar. Satellite imagery, like visible, infrared, and water vapor loops, provides a top-down view of what is going on above us that cannot be gathered from other sources. The imagery from GOES-16 has also been greatly improved, providing more frequent updates, with higher resolution, that can be zoomed-in to focus on active weather phenomena.

A comparison of the full-disk imagery available from a current GOES satellite (GOES-13, right) and the new GOES satellite (GOES-16, left). (Image courtesy: NOAA/NASA)
Think of it this way. You are going to replace a digital camera that takes pictures with a resolution of 5 megapixels, but only every 5 seconds. The new camera you buy has 20 megapixel resolution and can snap a picture every second! That is a great improvement right? 4 times better resolution and 5 times faster! Now add in that your old camera had 5 filters that could be applied and your new one has 16. That's how GOES-16 compares to its predecessors!


So what makes this satellite so important for the future of weather and science? Those who study weather, climate, space, and other environmental factors have reached the limit of what can be observed with the current satellites that have been in existence for about 20 years. GOES-16 will provide a wealth of new, and very valuable, information for climate scientists, meteorologists, and other researchers for the next couple of decades. In fact, an identical satellite, GOES-17, will be launched into orbit in spring 2018. While GOES-16 will be moved into an orbit that best covers the eastern U.S. in the next several months, GOES-17 will take up the position over the western U.S. within the next two years to provide complete coverage of the western hemisphere with the new satellites.

With the fire-hose of  new data, we will be able to observe the atmosphere above us with greater precision than ever before. This allows for improvements in severe weather warning lead time, detection of flash flood threats and wildfires in remote areas, volcanic ash that is a significant hazard to air travel, quicker recognition of rapid changes in tropical cyclone strength, and even dust over the oceans that hinders their formation. As we learn how to use the wealth of GOES-16 data, it will become a vital tool for atmospheric scientists for years to come.


You can learn more about GOES-16 and the entire series of GOES satellites, as well as view additional imagery, by visiting the GOES-R website hosted by NOAA and NASA. We have already shared some very cool "preliminary, non-operational" imagery from GOES-16 on our social media channels, such as that shown above, and we look forward to bringing you much more in the coming months and years!

One of the early images beamed back to Earth from GOES-16 shows an oblique view of  our planet with the moon in the background. (Image courtesy NOAA)
Alex Herbst, Meteorologist
MWN Intern

Erik Proseus
MWN Meteorologist

----
Follow MWN on Facebook, Twitter, and Google+
Visit MemphisWeather.net on the web or m.memphisweather.net on your mobile phone.
Download our iPhone or Android apps, featuring StormWatch+ severe weather alerts!
MWN is a NOAA Weather Ready Nation Ambassador Meteorologist Erik Proseus is an NWA Digital Seal Holder

Thursday, January 26, 2017

AMS: Best Practices for Sharing Weather Information on Social Media

Earlier this year at the American Meteorological Society's (AMS) 2017 Annual Meeting in Seattle, the AMS Council adopted a set of "best practices" for publicly sharing weather information via social media. As most of you are aware, there are many choices when it comes to consuming weather information. From local TV, to national cable channels, to government and private company websites, to NOAA Weather Radio, to social media, to mobile apps, and even your refrigerator... anyone (or anything) can produce weather data. That information may originate from a degreed or certified meteorologist, a broadcaster or reporter, a young person with passion but little to no training (that was me 25 years ago!), or (more often these days) just a computer model run through the Internet of Things.

At MemphisWeather.net, we our proud of the fact that our forecasts are human-powered by a meteorologist with 25 years experience in the Memphis area and our social media content is generated by either that same meteorologist, who also holds the National Weather Association Digital Seal, or meteorologists-in-training under the careful tutelage of said meteorologist. We have espoused the practices adopted by the AMS since our first tweet in April 2009. In the vein of full disclosure and public transparency, we thought it would be a good idea to list those best practices and let you decide if you agree with our (admittedly-biased) assessment. Here is a statement from the document on who should observe these practices:
The best practices outlined below aim to encourage the dissemination of high-quality weather information to the general public on social media platforms (i.e., mobile and web-based technologies)...These best practices are also designed to help social media users know what to look for and what to avoid when seeking weather information.
In other words, the best practices are an outline not only of what good weather information should look like on social media, but also what you should expect from your "trusted sources." With that, here they are, with sub-comments (in parentheses) edited only for length.

Best Practices for Publicly Sharing Weather Information Via Social Media

The overall goal should be delivering a time-sensitive product that communicates weather information clearly and professionally commensurate with the users’ understanding of the science. A quality social media weather information service should:

  • Differentiate between short-range forecasts, extended-range forecasts, and outlooks. (In short- or medium-range forecasts (i.e., less than 7 days), offer as much detail as the science allows. Do not imply that extended-range forecasts (i.e., 8 days and beyond) are as reliable as short-range forecasts. Clearly identify outlooks as such and avoid misrepresenting an outlook as a specific forecast of weather elements for a specific area.)
  • Recognize the limitations of numerical weather predictions. (When displaying or sharing computer model forecasts, identify them as such. )
  • Communicate uncertainty and be transparent. (When displaying or sharing forecasts that are highly complex and/or involve longer lead times, communicate the full range of scenarios. Communicate the degree of confidence in their forecasts and educate their users about the level of agreement among forecast models and the likelihood of a particular outcome. Respond to all comments and replies to their social media posts in a manner that offers insight into their forecast reasoning while being professional and respectful.)
  • Carefully and responsibly craft headlines and key messages. (If providers work in organizations where they do not have total control of all weather-related content, they should work diligently to educate and influence the appropriate content producers regarding the responsible communication of weather information.)
  • Offer a schedule for updates (While a regular schedule may not be applicable, providers of social media weather information should advise users when they can expect more information.)
  • Include NOAA watch, warning, and advisory products or hazardous weather outlooks.
  • Use discretion when disagreeing with “official” NOAA forecasts, especially during high-impact events. (The reasoning behind the forecast and the disagreement should be explained.)
  • Alert the public about appropriate response to severe weather events.
  • Include climatology information. (Put the current or predicted weather conditions into perspective with background climatology.)
  • Identify where and when weather data originated and provide appropriate credit.
  • Provide links to other relevant data. (This is especially true during hazardous weather situations when the user may need a source for weather alerts or information about the appropriate response to the hazardous weather.)

So, do we measure up? Let us know what you think in the comments. We promise none will be censored! And thanks for trusting MemphisWeather.net for your weather needs!


----
Follow MWN on Facebook, Twitter, and Google+
Visit MemphisWeather.net on the web or m.memphisweather.net on your mobile phone.
Download our iPhone or Android apps, featuring StormWatch+ severe weather alerts!
MWN is a NOAA Weather Ready Nation Ambassador Meteorologist Erik Proseus is an NWA Digital Seal Holder

Sunday, November 15, 2015

El Niño, part II: Global & local effects / MWN Winter Outlook

In part 1 of this blog series on El Niño, we examined the basics of ENSO (El Niño Southern Oscillation), including what exactly it is and how ocean temperatures affect global weather patterns, a little history as to how it was discovered, and how it is measured. In this final installment, we examine the typical effects of El Niño globally, as well as what we have experienced locally in prior El Niño years, and finally what we might expect this winter. This blog will also serve as the "2015-'16 MWN Winter Outlook" post that is commonly requested this time of year.

Global effects of El Niño

Though effects on the atmosphere over North America, and the rest of the world, vary with each El Niño, there are some typical atmospheric responses. The effects are most visible during the winter months, since that is when the waters of the Pacific tend to be warmest during El Niño years, and include:
  • Increased precipitation across the southern tier of the U.S, including drought-stricken California, due to a more active Pacific jet stream
  • Decreased precipitation across the Pacific Northwest and Ohio Valley
  • Warmer than average conditions across the northern half of the U.S. and southern Canada, as the polar jet stream is displaced further north
  • More coastal storms affecting the eastern U.S., and
  • In summer, suppressed activity in the tropical Atlantic and increased activity in the eastern Pacific.
Below are the typical El Niño patterns during the winter (top) and summer (bottom) months globally. These "typical" effects are often be offset by other, shorter-term, regional or global patterns that are much less predictable beyond a couple of weeks. For instance, just because a region is usually dry or cool doesn't mean the entire winter will fall into that pattern.


Regional effects of El Niño

Mid-South weather can be fairly fickle during El Niño winters, as we are typically positioned between the persistent Pacific jet stream that brings wet and cool conditions to the southern U.S. and a pronounced dry area over the Ohio River Valley, which can extend as far south of the Tennessee River Valley. If either of those areas shifts slightly due to other variables, Mid-South weather could end up either wetter or drier than average, particularly for short durations over the course of the winter.

Mid-South temperatures over the course of an El Niño winter are generally driven by shorter-term regional variations that occur. El Niño itself generally places us in a "near average" temperature regime, between cooler than average weather to the south (nearer the Pacific jet stream) and warmer than normal weather to the north.
Typical climate pattern over North America during El Niño winters. Graphic courtesy NOAA/CPC.

Other factors: Teleconnections

While El Niño will be the primary factor on our winter weather pattern, there are other climate influences (or "teleconnections") that may last only for a week or two at a time that frequently determine local weather conditions. These are much less predictable more than a couple of weeks in advance. These include the North Atlantic Oscillation (NAO), Arctic Oscillation (AO), Pacific Decadal Oscillation (PDO), Pacific-North American Pattern (PNA), and Madden-Julian Oscillation (MJO), among others. Here is a brief description of a few that can affect our weather:

North Atlantic Oscillation (NAO) - Outside of El Niño, one of the primary influencers of winter weather in eastern North America and Europe is the NAO. A positive NAO occurs when atmospheric pressure over the high latitudes of the North Atlantic (i.e., Greenland) is below average and areas in the central North Atlantic have above average pressure. A strong jet stream across the eastern U.S. into the north Atlantic keeps the coldest winter air bottled up to the north, resulting in above average temperatures for the eastern U.S. A negative phase features above average pressure over the high latitudes and usually results in below normal temperatures and a snowy pattern for the eastern U.S. as cold air is allowed to dip into the region due to a weaker jet stream. The NAO can shift from positive to negative multiple times within a season or may vary in strength but remain in the same phase for several months at a time. At least through the early stages of the winter season, a positive NAO is expected.

The North Atlantic Oscillation (NAO) measures pressure anomalies over the North Atlantic Ocean. Higher than normal pressure over the northern latitudes of the north Atlantic typically results in a cold and snowy pattern for the eastern U.S. in winter. Graphic courtesy Climate.gov

Arctic Oscillation (AO) - A positive AO occurs when the ring of winds circulating around the polar region (commonly referred to as the "Polar Vortex") is strong, keeping cold weather confined to the highest latitudes around the North Pole. Higher pressure results in the mid-latitudes, along with less frequent intrusions of Arctic air. In a negative AO phase, this wind circulation weakens, allowing the cold polar air to penetrate south into the middle latitudes and increasing storminess in these areas as the polar jet stream dips south. This is what has been referred to in the media last January as the "Polar Vortex" invading the U.S., when in actuality, it is always there, just not always as far south. The AO is difficult to forecast more than a couple of weeks into the future.

The Arctic Oscillation (AO) measures anomalies in pressure in the Arctic region. A negative phase occurs with higher pressure at the north pole, resulting in intrusions of cold air into the mid latitudes. A positive phase occurs when the cold air stays bottled up at the pole, resulting in higher pressure in the mid latitudes. Graphic courtesy Climate.gov.
Pacific Decadal Oscillation (PDO) - As its name implies, this teleconnection generally lasts much longer (years at a time), varying in strength but generally staying in the same phase for long periods. The PDO is defined by ocean temperature anomalies in the northeast and tropical Pacific Ocean, with a positive phase occurring when warmer than average sea surface temperatures are positioned along the Pacific coast and cooler than average temperatures are located in the interior northern Pacific. After about 16 years in a negative phase, the PDO went positive about two years ago and remains that way now. It is a fairly recently-described concept and thus it effects are not yet well understood.

Pacific-North American Oscillation (PNA) - The PNA describes a pattern of mid-level pressure readings in distinct areas across the Pacific and North America. Usually, these pressure readings (or "heights") are similarly anomalous in the Aleutian Islands of Alaska and the southeast U.S. In the positive phase, heights are above average around Hawaii and in western North America and lower in the North Pacific and southeastern U.S. The positive phase tends to result in cooler and drier weather for the eastern portion of the country in the winter and also tends to occur during El Niño conditions, but not always.

Average temperatures during a strongly positive PNA regime in January 1981, courtesy of the State Climate Office of North Carolina. The country was virtually split in half with very cold air in the east and warmer than normal air in the west.
Madden-Julian Oscillation (MJO) - The MJO is an "eastward moving disturbance of clouds, rainfall, winds, and pressure that traverses the planet in the tropics and returns to its initial starting point in 30 to 60 days, on average" (Climate.gov). Because it is an intraseasonal tropical climate variable, it can change over the course of weeks. Its phase (of which there are eight) can have dramatic impacts on mid-latitude weather, including cold air outbreaks over the eastern U.S. in winter, flooding rain, and jet stream changes.

As you can see, the state of each of these teleconnections can alter or even reverse the impacts of a "typical" El Niño season for periods during the winter, which then affects the overall averages. It's important to remember that "climate is what we expect, weather is what we get." Thus there can be a difference between long-term, or seasonal, averages and day-to-day weather that makes up that average.

Winter outlooks from other sources

As I state every year, I am not an expert climatologist. At MWN, the focus is, nearly exclusively, on the short to mid-term forecasts - those out to a week to 10 days. So, as usual, in putting together our Mid-South winter outlook, I consulted multiple sources and researched data from winters past that I felt were comparable to what we might experience this year from a general pattern perspective (called analogs, listed at the end of the post).

Significant weight was given to previous winters that had strong El Niño conditions but consideration was also given to winters with weaker El Niños which had similar sea surface temperatures outside the Pacific ENSO region, namely the eastern north Pacific and western north Atlantic, since they would be most likely to have an effect on U.S. weather. In particular, I feel the warm waters near the Pacific coast and those in the north Atlantic will play more than a passing role in weather patterns over the U.S. and influencing the Mid-South.

The winter outlooks that I gave the most credence to were those from NOAA and WeatherBell Analytics, as their reasoning is sound and I generally agree with their premises of their respective outlooks, even though they differ slightly. You'll find those outlooks shown below.

NOAA Winter Outlook


NOAA's temperature outlook for this winter leans heavily on climatological expectations associated with El Niño. Percentages represent the likelihood of  above/below normal temperatures. In other words, there is a >40% chance that much of Texas will see cooler than normal weather this winter.

NOAA's precipitation outlook for this winter also leans towards El Niño climatology, though it depicts southern U.S wetness extending north into the southern Plains and Front Range, as well as up the east coast. Percentages are read similarly to the temperature map above. "Equal chances" means there is no signal to indicate a greater chance of above or below normal precipitation.

WeatherBell Winter Outlook


WeatherBell temperature forecast for the winter season. Colors represent departures from average.  In many respects, this outlook agrees with NOAA depicting a warm winter for the north and cool winter for the south.  The eastern 1/3 of the U.S. is where they differ the most.

The snowfall forecast for this winter from WeatherBell, expressed as percent of normal. Recall that for the south, where values are forecast well above average, snowfall amounts are typically not high, so a 150-200% of normal forecast could be only a few inches difference. NOAA does not expressly predict snowfall in their winter forecast. 

The MWN Winter Outlook


1. Temperature
All of that said, there is fairly strong consensus that Mid-South winter will start off warmer than it will end. In other words, the temperature anomalies will be positive (above normal) through December, then descend into negative (below normal) territory by February and March. In fact, the average temperature in December for the ten El Niño winters examined (analogs listed below) was 0.9° above normal while the average February temperature was 3.4° below normal. Thus I expect temperatures will be above normal, on average, through the end of the year before beginning to trend downward. Similar to last year, February and early March have the potential to be a fair amount below normal in the temperature arena.

2. Precipitation
Precipitation-wise, a warmer early season tends to support more atmospheric moisture than a cold season and our analog winters support that as well. By the time the latter half of the winter arrives, precipitation in the analogs falls below normal. In a classic El Niño setup, precipitation is usually near average in the Mid-South, but drier anomalies in the Ohio Valley can sometimes creep south into west and middle TN as well. Therefore, we are of the opinion that the winter will start off with above normal precipitation and the latter half of the season will be slightly below normal.  We also believe that severe weather activity will continue to be below average, which is fairly common in El Niño years.

3. Snowfall
The most anticipated part of the forecast, snowfall tends to be near the long-term average for the season, though it can be fairly variable. This is because one snow storm (or the lack thereof) can result in a season that is well above (or below) normal, since not much typically falls. (Memphis International Airport averages 3.4" of snow each year.) Last year, the December-February snow total was 2.3", or about an inch below normal. However, the first light accumulation actually occurred very early (0.1" in mid-November) and the biggest ice/snow event of the season actually occurred in the first week of  March, both outside the typical "winter" season. So for 2015-'16, we are predicting slightly above normal snowfall for the season (4-5") with the majority of that likely to occur later in the winter, not dissimilar to last year. With a forecast of cooler air in place in February to early March, we believe there is an above average probability of a late season snowfall in the Mid-South once again.


So there you have it - the predictions for 2015-'16 winter! If you're interested in how I did last year, take a look at this blog post from last March. In a nutshell, the winter of 2014-'15 was cold, dry and snowy. I had forecast temps below to slightly below average (correct), precipitation near average (incorrect), snowfall near to above average (correct), and large temperature swings with periods of severe weather (partially correct).

Footnote:
The analog years we examined for this year's outlook were 1919-20, 1957-58, 1972-73, 1982-83, 1991-92, 1994-95, 1997-98, 2002-03, 2009-10, and 2014-15. These included the 3 strongest El Niños on record (to this point): 1997-98, 1972-73, and 1982-83. Click here to view the raw data for each of these winters.

Erik Proseus
MWN Meteorologist

----
Follow MWN on Facebook, Twitter, and Google+
Visit MemphisWeather.net on the web or m.memphisweather.net on your mobile phone.
Download our iPhone or Android apps, featuring StormWatch+ severe weather alerts!

Friday, November 13, 2015

El Niño, part I: The basics

With words like "Godzilla" and "strongest on record" being thrown around in relation to this winter's pending El Niño, you might be wondering just what El Niño is and what effects it will have on Mid-South weather. This is the first of a two-part blog series answering those exact questions.

In this installment, we'll answer the question "What is El Niño?" by putting the semi-technical terminology and atmospheric explanations on a shelf where you can reach it. In part 2, we'll look more closely at what the effects of El Niño conditions usually are globally and in our little corner of the world.


History of El Niño

El Niño traces its roots to a warming of the Pacific Ocean along the Ecuador/Peru coast in December, when the fishing season typically ends. El Niño literally means "The Little Boy" or "Christ child" in Spanish because the warming typically coincided with the Christmas season. Despite some annual warming, it was discovered that every few years the warming was more pronounced and coincided with heavy rainfall in typically dry coastal regions of Ecuador and Peru. Mid-20th century scientists discovered that the warming wasn't confined to the far eastern Atlantic, it actually spread across the eastern into the central Pacific near the Equator.

Link to the atmosphere

Further study in the 20th Century resulted in a discovery that the warming of the ocean water was also coupled with an atmospheric pressure oscillation called the Southern Oscillation. The oscillation of pressure results in changes in trade wind patterns (a prevailing pattern of surface winds blowing from the east found in the tropics) and rainfall distribution.

In "normal" conditions which are not El Niño or La Niña (commonly called "La Nada"), trade winds across the Pacific blow towards the west, causing warmer water near the surface of the ocean to be pushed westward. The temperature difference between cooler water to the east and warmer water in the west results in rising air over the western Pacific. This air evacuating the low levels of the atmosphere lowers the air pressure near the surface. In combination with warmer water that produces more evaporation in the same area, more clouds form and abundant rainfall occurs in the western Pacific. At the same time, in the east Pacific (off the coast of South America), atmospheric pressure is higher due to sinking air and rainfall is minimized.

Normal ("La Nada") conditions are shown above in a graphic from the Australian Bureau of Meteorology. Easterly trade wind pushes warmer water westward, resulting in lower pressure and increased precipitation over the west Pacific and cooler, drier conditions in the eastern Pacific.

In El Niño conditions, the trade wind weakens (or even reverses course in the strongest El Niños) and the warmer water shifts to the central and eastern Pacific, rather than the west Pacific. Rainfall patterns also shift, as rain tends to fall over warmer water for the reasons described above. Thus the normally-dry western coast of South America becomes wet and rainfall slacks off in the western Pacific. The shift in atmospheric heat, as a result of the displacement of warmer Pacific waters, disrupts atmospheric circulations globally, causing changes in weather and climate in places far removed from the Pacific Ocean, including across the United States.

El Niño conditions are shown above in another graphic from the Australian BOM. Easterly trade wind weakens, or even reverses, resulting in warmer water in the central and eastern Pacific and increased precipitation in the same regions. The western Pacific becomes drier with higher average pressure readings.

The ENSO Cycle

The complete name for El Niño is "El Niño/Southern Oscillation," or ENSO. The complete cycle from La Niña (the reverse condition of El Niño) to El Niño make up the "ENSO Cycle." El Niño episodes tend to occur every 2-7 years and typically last about 9-12 months. Much like a human being with a fever, there are varying degrees of El Niño and La Niña conditions, some relatively weak and others quite strong. It would follow that influences of ENSO can also vary widely, including the timing, duration, and intensity of the conditions.

How is ENSO measured? (this is a little more technical...)

The typical measurement that the National Oceanic and Atmospheric Administration (NOAA) uses to officially declare that El Niño conditions are occurring is based on sea surface temperatures (SST) in key areas of the equatorial Pacific, more specifically sea surface temperature anomalies (departure from normal). NOAA's Climate Prediction Center defines El Niño conditions as existing when three conditions are met:

  • a one-month positive SST anomaly of 0.5°C or greater is observed in the Niño-3.4 region of the Pacific Ocean (see map below),
  • an expectation that the 3-month Oceanic Niño Index (ONI, defined below) threshold will be met, and
  • an atmospheric response typically associated with El Niño is observed over the equatorial Pacific

The Niño regions along the equatorial Pacific are shown above. Niño 3.4, which is the key region for declaration of an El Niño pattern, encompasses the central portions of the Niño 3 (in red) and Niño 4 (in yellow) regions.

The ONI is a running three-month average of SST anomalies for the key Niño 3.4 region. "Events" (El Niño or La Niña) are defined as five consecutive overlapping 3-month periods at or above the +0.5°C anomaly for warm (El Niño) events and at or below the -0.5°C anomaly for cold (La Niña) events. In other words, El Niño is not officially declared until five consecutive three-month averages are at least 0.5°C above normal, which happens seven months into an El Niño event, since running averages are used.


For example, ONI values over the past year (shown below) featured three consecutive three-month periods that met the 0.5°C threshold (from OND '14 through DJF '15), but fell short of official El Niño status when the JFM '15 anomaly was just below the 0.5°C threshold. However, since FMA '15, the Pacific has produced five consecutive ONI values at or above the 0.5°C threshold (in red below), including the most recent 1.7°C value. Thus, El Niño officially began in February 2015, but was not declared until the June-Aug. '15 average was calculated in early September.

Oceanic Niño Index (ONI) values since winter 2014. The past 7 three-month periods have equaled or exceeded 0.5°C. When 5 of these periods reach 0.5°C consecutively, an El Niño is declared by NOAA.
According to NOAA, El Niño conditions are expected to peak this winter and then decline heading into next spring and beyond, thus El Niño will be a major driver of weather and climate throughout the upcoming winter.

For more information on ENSO, see NOAA's Climate Prediction Center website, NOAA's El Niño Portal, or this page from the Pacific Marine Environment Laboratory.


In the second part of this blog series, we will look more closely at 1) the effects of El Niño both globally and locally, 2) Mid-South weather in historical El Niños, and 3) what we expect from the weather this coming winter! Will it mean a colder or wetter winter? Find out here!

Erik Proseus
MWN Meteorologist

----
Follow MWN on Facebook, Twitter, and Google+
Visit MemphisWeather.net on the web or m.memphisweather.net on your mobile phone.
Download our iPhone or Android apps, featuring StormWatch+ severe weather alerts!

Wednesday, October 7, 2015

MWN Lightning Round: Joaquin forecasts, 1000-year rain, and the weekend forecast


It's time for another edition of the MWN Lightning Round! Today we tackle a couple topics related to recent events on the east coast and tropics, as well as take another quick look at the weekend forecast, which has changed a bit in the past couple of days.

Hurricane Joaquin track forecasts

Early last week, eyes turned towards the warm waters of the Caribbean as Joaquin spun up and quickly became a major hurricane as it churned into the Bahamas where above average warmth and low wind shear aided rapid development. There's been a lot of talk in the aftermath (when you can break through the conversation about SC flooding, which is definitely worthy of plenty of it!) about the performance of the American (GFS) model vs. the European (ECMWF) model.

Once again, the ECMWF handily beat its American counterpart on the forecast track of Joaquin, indicating that the nearly 10-year long streak of no major hurricane landfalls on U.S. shores would remain intact. While the European model nearly pegged the eventual track of the storm as early as Monday night, the GFS didn't release the east coast from its sights until Friday morning (after the storm had reached the Bahamas) and took another 4 model runs (24 hours) to correctly show that there was a higher threat to Bermuda than the Canadian Maritimes. Credit goes to the National Hurricane Center for keeping the official forecast track off the east coast and not issuing tropical watches on U.S. soil in deference to the European model, despite the consensus of the rest of the models showing an eastern U.S. landfall.

The European model forecast for Hurricane Joaquin as of Monday night, September 28th, correctly showing a trip into the central Bahamas, followed by a turn to the northeast, close approach to Bermuda, and eastward turn south of 40° north. Graphic courtesy WeatherBell Analytics. Used with permission.
The American (GFS) model forecast for Tuesday night, September 29th, showing landfall near Norfolk, VA and significant direct impact to the Mid-Atlantic region. This forecast was made 24 hours after the above track produced by the European model. The GFS didn't eliminate direct impact to the U.S. as a possibility until late in the week. Graphic courtesy WeatherBell Analytics.
Having followed these models regularly for years, my primary comment here is this: the American model generally does a very good job in the short to medium-range (out to a week) and compares favorably with the European model in general. However, when the spotlight is on (Hurricanes Sandy and Joaquin immediately come to mind), it has fallen short. What must not be forgotten is that the massive northeast blizzard that was predicted to bury NYC last winter (and ended up being a "regular snowstorm" for a well-prepared northern metropolis) was actually best forecast by the American-made GFS, whereas the European led forecasters astray, at least in the area that gets the most media attention, the Big Apple.

What is a 1,000-year rain event?

Since we're talking about Joaquin, this is a good opportunity to discuss another misunderstood, and unfortunately poorly-explained, topic (at least by the mainstream media) that we've all heard in reference to the historic flooding this past weekend. Portions of South Carolina received a 1,000-year rain event. What does that mean, besides that it is historic, catastrophic, and devastating all at the same time?

Let's start with what it is NOT. First, it was not a 1,000-year FLOOD event. That is different from a 1,000-year RAIN event. A 1,000-year rain event does NOT mean that: a) it's been 1,000 years since the last rain of this magnitude, despite what Stephen Colbert or the Governor of South Carolina says, b) it'll be 1,000 years before this much rain falls again, or c) it only rains this much every 1,000 years.

A 1,000-year rain event actually means that there is a 1/1,000 chance that a certain amount of rain will fall in the given period, or that there is a 0.1% chance of it occurring. Could it occur again next year? Sure! A good way to describe this (and credit to the CoCoRaHS blog for this great example) is to imagine 1,000 ping pong balls in a box. All but one are white, the other is red. With your eyes closed, you pull a random ball out of the box. You have a 1/1,000 (0.1%) chance of grabbing that red ball. You then put that ball back in the box, mix them up, and grab a ball again. Once again, you have a 0.1% chance of pulling the red ball. The fact that you picked it out the first time does NOT affect your chances the subsequent time. Therefore, a 1,000 year rain event may not happen for 2,000 years, or you may see it much more often than every 1,000 years!

The last comment on these "recurrence interval" events, whether 1,000-year, 500-year, or 100-year event, is that the amounts of rain vary significantly from one place to another. For example, for Memphis, a 1,000 year rain event is 10.64" in 24 hours, while in Phoenix, it is 4.82" in 24 hours. Also, average recurrence intervals are calculated not just on 24 hour rainfall amounts, but on several different timeframes. The recurrence intervals for Memphis are shown below. As an example, a 100-year rain event is 8.02" in 24 hours or 3.20" in 1 hour.

Average recurrence intervals for precipitation events for Memphis, TN. Data courtesy City of Memphis/Shelby County Storm Water Management Manual.

Weekend forecast

In a post earlier this week, we discussed the warm weather mid-week (which we're experiencing... mid 80s can leave anytime thank you) and the passage of a cold front on Friday. That post mentioned minimal rain chances with the front, but computer models are picking up on more moisture along and behind the front and we've added a 30% chance of showers and maybe a few thunderstorms to the Friday afternoon forecast, as well as a 40-50% chance of evening showers.

GFS Wednesday morning forecast model of total rainfall for Friday and Friday night. Graphic courtesy WeatherBell Analytics.
The good news: we could really use some rain after a dry month, so a quarter inch of liquid will be welcome for some, plus it'll be gone for the Columbus Day weekend, so expect cooler and drier conditions Saturday and Sunday with clouds departing by mid-day Saturday. The bad news: you might need a poncho or umbrella at any Friday night events outdoors, including football games and the Levitt Shell concert. If forecast trends hold, we could see a steady rain during the evening with north breezes making it feel a fair amount cooler than the daytime hours when highs will reach the lower to mid 80s.

Keep abreast of the latest forecast conditions from MWN with our mobile apps, perfect for checking radar and our human-powered forecast while out and about. Links to download can be found below.

Erik Proseus
MWN Meteorologist

----
Follow MWN on Facebook, Twitter, and Google+
Visit MemphisWeather.net on the web or m.memphisweather.net on your mobile phone.
Download our iPhone or Android apps, featuring StormWatch+ severe weather alerts!

Saturday, July 25, 2015

A hot mess - and why dewpoint is more important than humidity

An Excessive Heat Warning has been issued for the majority of the metro (Fayette County is technically under a Heat Advisory, but I'm not quibbling when the heat index has reached the danger level). The Excessive Heat Warning is in effect until Sunday at 8pm, but I have high confidence that we'll see it extended, possibly through Wednesday, before a front finally starts to move in our direction by week's end.

Excessive Heat Warning through Sunday in pink, Heat Advisory in orange. Graphic courtesy NWS-Memphis.

After a short break from the mid and upper 90s (but not the high humidity) earlier this week, plus a few rounds of strong thunderstorms, upper level ridging builds anew and can be thanked (or cursed) for pushing temps back into the mid 90s to near 100 for the next several days.  Rain chances are minimal to nil through Wednesday as well. These are the dog days... woof.


If it's any consolation, we are nearing the end of the hottest part of the year, climatologically. When eliminating rounding of temperatures to the nearest degree, the period from July 11-27 has the highest average daily temperature at 82.8°. Starting next week we slip a tenth of a degree or so! OK, that didn't help you any.  Maybe this will...

Perhaps this will make you feel a little better Memphis!
Posted by MemphisWeather.net on Saturday, July 25, 2015


So, besides hot temperatures, why are we seeing heat index values near or above 110°? Maybe you've heard this before: "It's not the heat, it's the humidity." (Well, in this case, it's the heat too. Let's not kid ourselves!) But there is truth to that statement. Let's look a little closer at humidity.

Relative humidity vs. Dewpoint

When humidity values are reported, it's actually "relative humidity" that we're talking about. It's relative to the temperature. For instance, if you track humidity during a normal day, you'll see that it peaks around sunrise and bottoms out in the late afternoon. However, even though the air is closer to saturation when relative humidity is highest, relative humidity doesn't actually tell you how much water content is in the air. Besides temperature, water content is the most important factor in determining how "uncomfortable" it feels.

Consider a calm, clear spring morning with temperatures in the mid 50s. The relative humidity is 90%. Now consider early this morning, with temperatures near 80 and relative humidity of 80%. In our example, the humidity was 10% lower this morning, so it wasn't as sticky as our spring example morning right? Wrong! Behold, I give you the more appropriate measure of water content (and uncomfortability - yes I made that up): DEWPOINT.  Dewpoint is the temperature to which air must be cooled to be saturated (or achieve 100% relative humidity).

Let's look at yesterday's observations from Memphis International Airport (below). Notice the humidity (yellow highlight column) falls from 88% in the morning when the temperature was 76° to 49% in the afternoon when the temperature was 95° (orange highlighted rows). That humidity value is "relative" to the temperature. Did the amount of water content in the air change from one time to another? Barely. We know this by looking at dewpoint (green highlight column). It was 72° when the temperature was 76° and 73° when the temperature was 95°. It inched up 1°, thus the amount of water content of the air changed very little. You'll also notice that the dewpoint is generally is more consistent (in the 72-76° range all day) than relative humidity, which varied from about 50-90%.


So, you say "50% humidity doesn't sound all that high!" Did you go outside yesterday afternoon? The air felt very humid! 50% in the morning is low humidity, but 50% in the afternoon is high! Dewpoint helps straighten all this out, since it measures the amount of water vapor in the air no matter the temperature!

Dewpoints above 65° usually cause people to start to notice the "humidity" in the air. Dewpoints above about 72° are very uncomfortable and when a dewpoint reaches the upper 70s to near 80° it's best to just avoid the outdoors altogether, especially if you have health issues! The amount of water vapor in the air at a dewpoint of 80° is so high that it can cause heat illness fairly quickly for those who aren't taking every possible precaution.

It's rare to see dewpoints this high at properly sited professional equipment that is well-maintained and in open areas, such as at large airports. However, in the MWN backyard, the grass is green and thick, moisture is constantly evaporating due to the heat, and there is less mixing of the air due to being sited in a neighborhood with obstructions. Even with well-maintained semi-professional equipment, the dewpoint has been reading 80° recently. I can assure you, having to mow that green thick grass that I can feel every degree of that ridiculous dewpoint! The sweat does little evaporating with that much moisture already in the air.

MWN's Bartlett reporting station, surrounded by grass and slightly sheltered by fences. These factors contribute to a higher dewpoint in this locale than at the airport.
So when someone comments on the humidity from now on, you can take a mental note that it's actually the dewpoint that determines how uncomfortable it feels!

Erik Proseus
MWN Meteorologist

----
Follow MWN on Facebook, Twitter, and Google+
Visit MemphisWeather.net on the web or m.memphisweather.net on your mobile phone.
Download our iPhone or Android apps, featuring StormWatch+ severe weather alerts!

Thursday, June 4, 2015

Heat Safety: A Complete Guide from MWN

Many Memphians are aware of, or experienced, the record-breaking heat of the summer of 1980, even though it was 35 years ago this summer. The longest streak of 90-degree temperatures in Memphis recorded history was July 25-September 16, 1980 (54 days). Just prior to that, the longest recorded streak of 100-degree days occurred, a 15-day stretch from July 6-20, 1980, including the all-time record high of 108°F set on July 13, 1980. Eight July days still have high temperature records set that year and 12 July days have maximum low temperature records, all of them at or above 82°F (Source: http://www.memphisweather.net/alltime-shtml).
A graph of observed temps (blue bars) for July 1980 in Memphis shows just how hot it was that month. Many days set record highs (red line) with temperatures above 100° and low temperatures frequently above 80°.
The hot weather of July 1980 resulted in 83 deaths in Memphis and at least 1,700 nationwide during that summer. This heat wave tragically demonstrated that heat and humidity can be a deadly combination. These factors put a lot of stress on the human body and can lead to serious health conditions such as heat exhaustion, heat stroke, or even death. The more extreme the temperature, the shorter the amount of exposure time needed to fall ill.

The Dangers of Excessive Heat

Heat waves have the potential to cover a large area, exposing a high number of people to a hazardous combination of heat and humidity. In fact, heat is typically the leading cause of weather related fatalities each year, averaging 123 deaths per year from 2004-2013 and even more heat-related illnesses. From 1998-2014, an average of 37 children nationwide have died each year from heat stroke in a vehicle. High temperatures and humidity, and thus heat-related illness, are common in the Mid-South.

Heat Index - a measure of how hot it feels

The Heat Index is a measure of how hot it really feels when relative humidity is factored in with the actual air temperature. To find the Heat Index temperature, look at the Heat Index Chart below or check this Heat Index Calculator. As an example, if the air temperature is 96°F and the relative humidity is 50%, the heat index - how hot it feels - is 108°F. The red area without numbers indicates extreme danger.

The National Weather Service in Memphis issues a Heat Advisory when the Heat Index is expected to peak between 105°F-109°F.  An Excessive Heat Watch is issued when, 24-72 hours in the future, the Heat Index is expected to exceed 110°F and overnight low temperatures will be above 75°F. An Excessive Heat Warning is issued when the Watch criteria above are occurring or imminent (within 24 hours). Since heat index values were devised for shady, light wind conditions, exposure to full sunshine can increase heat index values by up to 15°F.

Heat Safety Tips

Here are some hot weather safety tips to consider during the "dog days" of a Memphis summer:
  • Slow down! Reduce, eliminate or reschedule strenuous activities until the coolest time of the day. Children, seniors and anyone with health problems should stay in the coolest available place, not necessarily indoors.
  • Dress for summer. Wear lightweight, loose lifting, light-colored clothing to reflect heat and sunlight.
  • Eat light, cool, easy-to-digest foods such as fruit or salads.
  • Drink plenty of water (not very cold), non-alcoholic and decaffeinated fluids, even if you don't feel thirsty. If you on a fluid restrictive diet or have a problem with fluid retention, consult a physician before increasing consumption of fluids.
  • Use air conditioners or spend time in air-conditioned locations such as malls and libraries.
  • Use portable electric fans to exhaust hot air from rooms or draw in cooler air.
  • Do not direct the flow of portable electric fans toward yourself when room temperature is hotter than 90°F. The dry blowing air will dehydrate you faster, endangering your health.
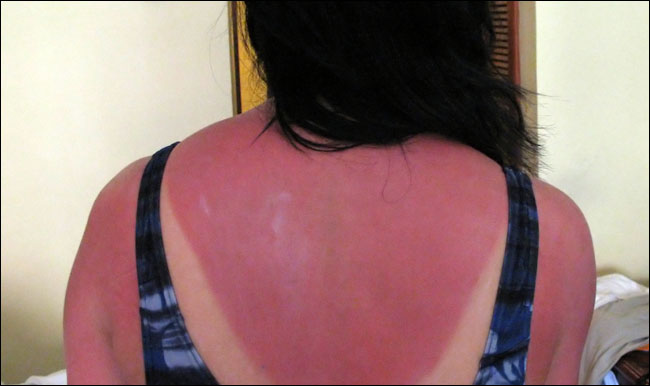
  • Minimize direct exposure to the sun. Sunburn reduces your body's ability to dissipate heat.
  • Take a cool bath or shower.
  • Do not take salt tablets unless specified by a physician.
  • Check on older, sick, or frail people who may need help responding to the heat. 
  • Keep your children, disabled adults, and pets safe during tumultuous heat waves. Make sure outdoor pets have a shaded place to stay and that they have plenty of fresh water.
Parents, here are additional tips as you care for children in hot weather:
  • Touch a child's safety seat and safety belt before using it to ensure it's not too hot before securing a child
  • Never leave a child unattended in a vehicle, even with the windows down, even for just a minute
  • Teach children not to play in, on, or around cars. They could accidentally trap themselves in a hot vehicle.
  • Always lock car doors and trunks - even at home - and keep keys out of children's reach.
  • Always make sure children have left the car when you reach your destination. Don't leave sleeping infants in the car ever!
Graph courtesy NoHeatStroke.org showing how fast an enclosed vehicle heats up. 
Even on mild days in the 70s, studies have shown that the temperature inside a parked vehicle can rapidly rise to a dangerous level for children, pets and even adults. Leaving the windows slightly open does not significantly decrease the heating rate. The effects are more severe on children because their bodies warm at a rate 3-5 times faster than adults. A dark dashboard or carseat can quickly reach temperatures in the range of 180°F to over 200°F. These objects heat the adjacent air by conduction and convection and also give off long wave radiation, which then heats the air trapped inside a vehicle. For more information on preventing children's deaths due to heat stroke, visit NoHeatStroke.org or download this fact sheet (PDF).


Heat Illnesses

The following information is courtesy of the Centers for Disease Control and Prevention. Heat cramps may be the first sign of heat-related illness, and may lead to heat exhaustion or stroke. Symptoms include painful muscle cramps and spasms, usually in the legs and abdomen, and heavy sweating. To treat cramps, apply firm pressure on cramping muscles or gently massage them to relieve spasm. Take sips of water unless nausea occurs, then stop drinking.

If a person experiences any of the following symptoms, heat exhaustion may have set in: heavy sweating; weakness; cool, pale, clammy skin; fast, weak pulse; possible muscle cramps; dizziness; nausea or vomiting; or fainting. Treatment includes laying the person down in a cooler environment, loosening clothing, applying cool, wet cloths to as much of the body as possible, fanning the body, and sips of water. If the person vomits more than once, seek immediate medical attention.

Heat stroke is the worst type of heat illness and is sometimes marked by an altered mental state. One or more of the following symptons is present: throbbing headache, confusion, nausea, dizziness, shallow breathing. Also the body temperature rises above 103°F, skin becomes hot, red, dry or moist, a rapid and strong pulse is felt, and the person faints or loses consciousness. Heat stroke is a severe medical emergency. Call 911 or get the victim to a hospital immediately. Delay can be fatal. Do not give fluids, otherwise treat the person as you would for heat exhaustion until medical assistance arrives.


For more information on heat safety, check out this detailed heat awareness webpage from the National Weather Service.  Most of the information contained in this article was originally published by NOAA/National Weather Service and NoHeatStroke.org. MemphisWeather.net is a NOAA Weather-Ready Nation Ambassador and we use their published material to help improve the nation’s readiness, responsiveness, and overall resilience against extreme weather, water, and climate events.

----
Follow MWN on FacebookTwitter, and Google+
Visit MemphisWeather.net on the web or m.memphisweather.net on your mobile phone.
Download our iPhone or Android apps, featuring StormWatch+ severe weather alerts!